


背景介绍:
参考本文,你可以举一反三来释放Fofa潜能!
Shodan是一款备受喜爱和广泛使用的攻击面管理工具。但是你真的会使用它吗?希望本文能对你的漏洞挖掘之路有所帮助。
基础知识:
作为漏洞赏金猎人只需要记住4个基本的规则即可:
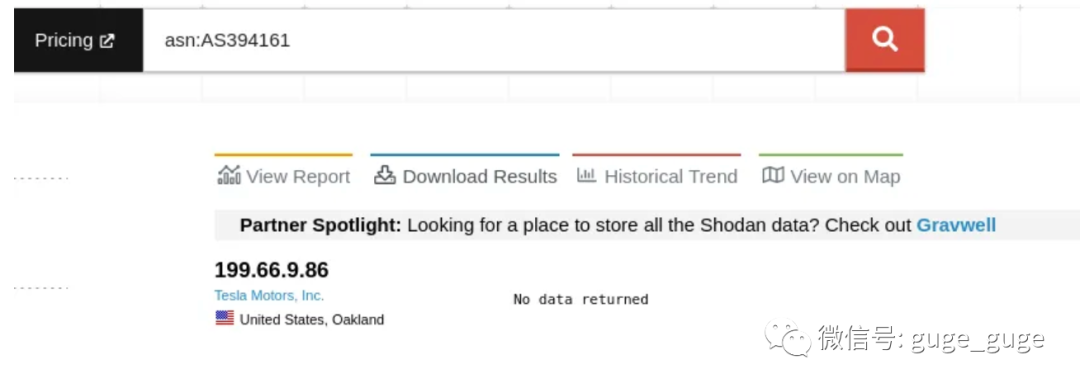
1、asn:{ASNnumber} 大型组织往往会有大量的IP,因此他们可能拥有自己的“互联网部分”,即IP集合,然后分配一个自治系统编号,Shodan可以通过这些编号进行搜索,以获得与公司相关的所有资产。
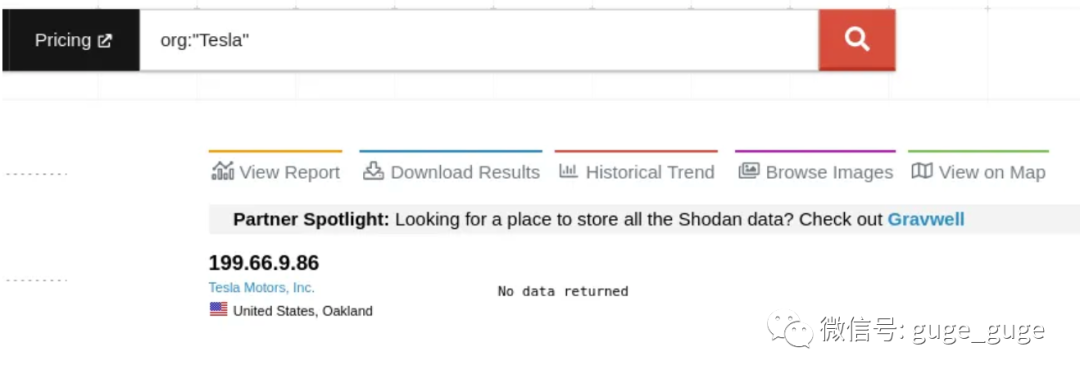
2、org:Company name同样,Shodan将使用其关联的组织名称来组织IP,可以使用“org” Dork 来检索这些IP。
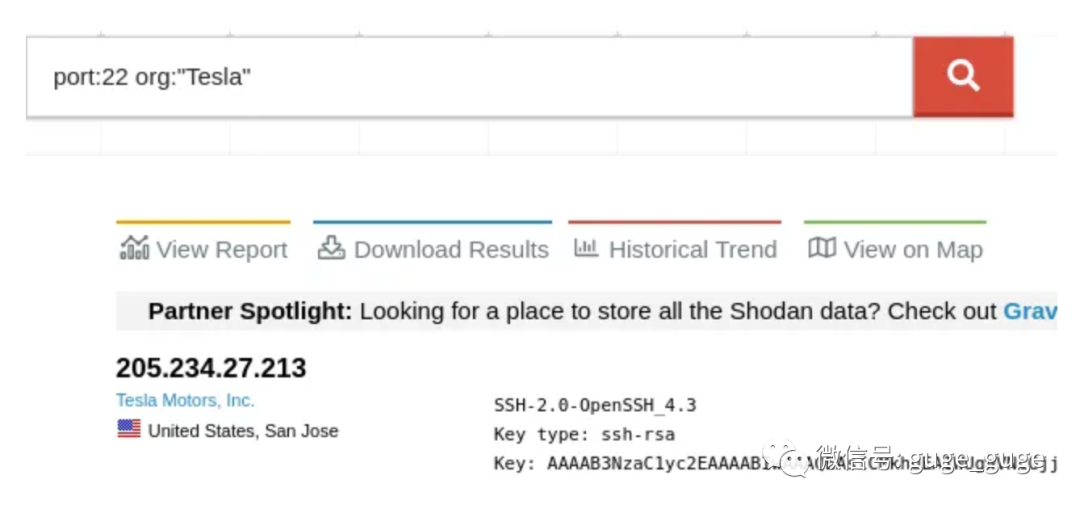
3、port:{PortNumber} 可以用来搜索已开启(或至少曾开启)的特定端口。
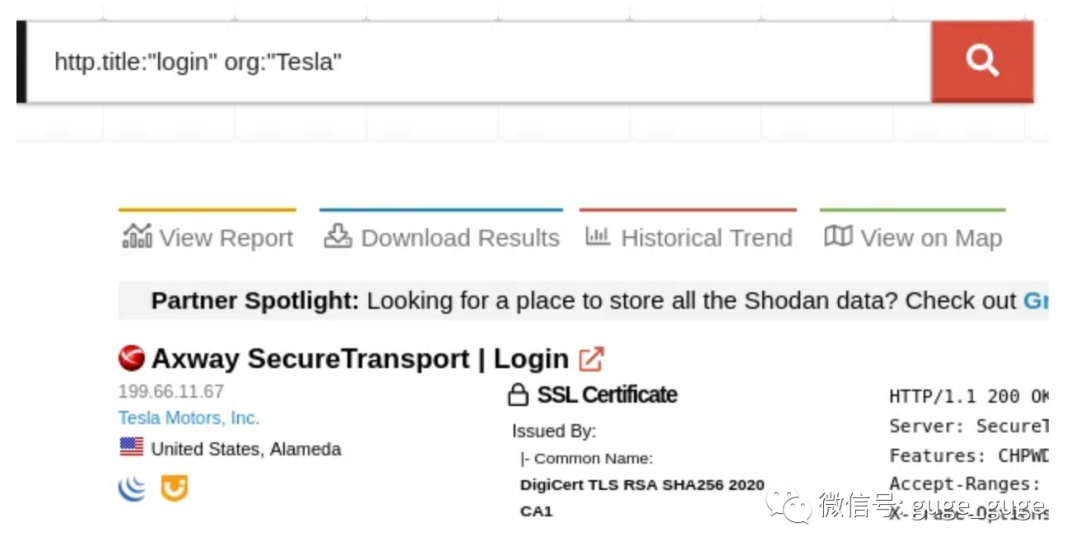
4、最后,使用http.title:title搜索特定内容。
如何正确使用Shodan:
大多数人只会以一种方式使用 Shodan,尽管有四种方式——它们各有利弊。
首先,也是最著名的,Shodan 有一个 GUI——一个搜索栏——用于查询数据,它没什么特别之处,但它适用于较小规模的项目或测试。
https://www.shodan.io/search?query=test
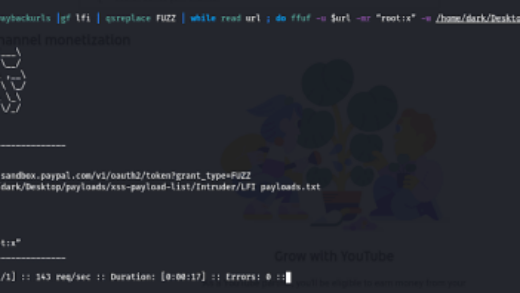
其次,通过 CLI 的 Shodan, Shodan 允许通过命令执行查询和分析,这能够自动化你的工作流程、扩展项目并节省时间。如果想查看官方文档,可查看 (https://cli.shodan.io/#commands)。如果想要识别趋势、搜索特定技术的漏洞或查找0day漏洞,则该功能特别有用。
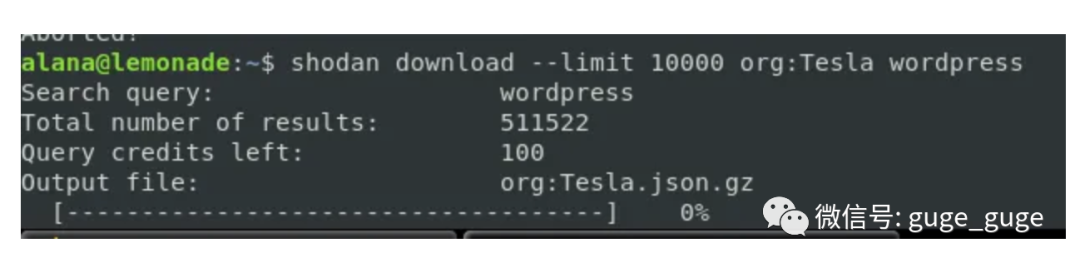
Shodan Download -下载功能会创建一个大型数据集,其中包含在本地执行查询所需的所有信息,从而为你节省API积分、允许重复分析并节省带宽,类似于数据库操作。shodan download –limit -1 org:Target wordpress
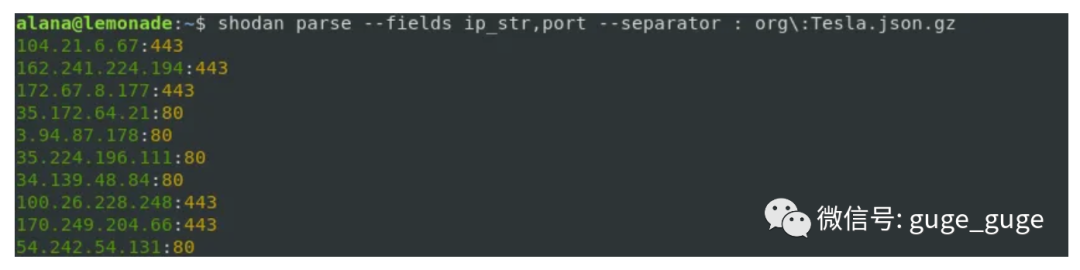
Shodan Parse -使用Parse函数可以从数据集中有选择地检索必要数据,然后可以将这些数据输送到进一步的工具链中。
Shodan Monitor 基本上很少被提及,它允许持续监控 IP 以获取更新,并且它是需要付费后才能使用,对于漏洞赏金猎人来说并不实用,这项服务也可以通过其他工具(例如 Massscan)作为替代方案,本文不做过多介绍。
最后,Shodan 有浏览器扩展,可以在后台运行并获取所在页面的有关信息。在寻找漏洞时,我们通常会在搜索网络应用程序时寻找端口 80/443,但通常会忽略其他端口,例如 8080、8888 等。因此,在目标获得更多信息会给你带来更多发现漏洞的机会。

此外,它还为我们提供了一个很好功能,如果我们需要更多信息,我们可以右键单击一个站点,然后在 Shodan 上搜索确切的页面。

Shodan Dork List:
本文的重点来了,下面是一些常用的Shodan Dork 规则列表,建议收藏:
title:”kibana” port:”443"
”230 login successful” port:”21"
vsftpd 2.3.4 port:21
230 ‘anonymous@’ login ok
set-cookie: webvpn;
Siemens S7
vsftpd 3.0.3
Set-Cookie: phpMyAdmin
Set-Cookie: lang=
Set-Cookie: PHPSESSID
Set-Cookie: webvpn
Set-Cookie:webvpnlogin=1
Set-Cookie:webvpnLang=enHow to do this appropriately
Set-Cookie: mongo-express=
Set-Cookie: user_id=
Set-Cookie: phpMyAdmin=
Set-Cookie: _gitlab_session
X-elastic-product: Elasticsearch
x-drupal-cache
access-control-allow-origin
WWW-Authenticate
X-Magento-Cache-Debug
kbn-name: kibana
X-App-Name: kibana
x-jenkins
org:’company’ port:’80, 81, 443, 8000, 8001, 8008, 8080, 8083, 8443, 8834, 8888'.
site:target.com
inurl:admin
intitle:login
site:website.com
intitle:/admin
site:website.com
inurl:admin
intitle:admin
intext:admin
kibana content-length:217 net:cidr
html:Dashboard Jenkins http.component:jenkins
X-Amz-Bucket-Region
x-jenkins 200
X-Generator: Drupal 7
all:mongodb server information all:metrics
port:27017 -all:partially all:fs.files
port:9200" all:elastic indices
product:elastic port:9200
title:system dashboard html:jira
product: apache tomcat
html:secret_key_base
html:rack.version
title:Citrix Gateway org:*programorg*
authentication disabled RFB 003.008
html:/dana-na/
Docker Containers: port:2375
root@ port:23 -login -password -name -Session
Cisco IOS ADVIPSERVICESK9_LI-M
Server: NessusWWW
230 login successful port:21"
感谢阅读,如果觉得本文还不错的话,欢迎分享给更多喜爱的朋友们~